BioSorter Multi-Range Cytometer
Software

FlowPilot software for BioSorter
FlowPilot Software
Union Biometrica’s FlowPilot software was developed for BioSorter and COPAS FP instruments with the demanding flow cytometry user in mind. But the software is intuitive and easy-to-use so you don’t have to be an expert to begin using FlowPilot equipped instruments.
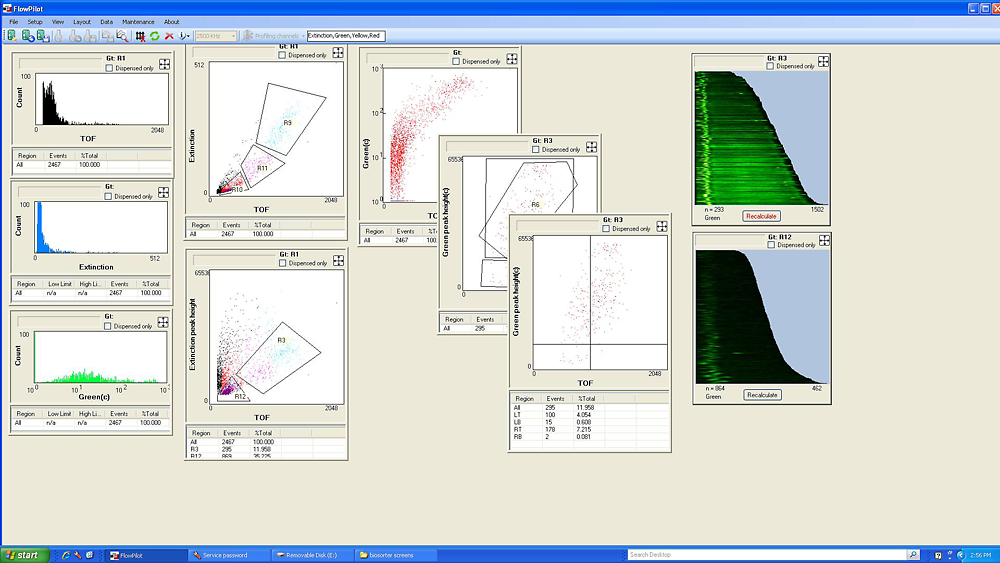
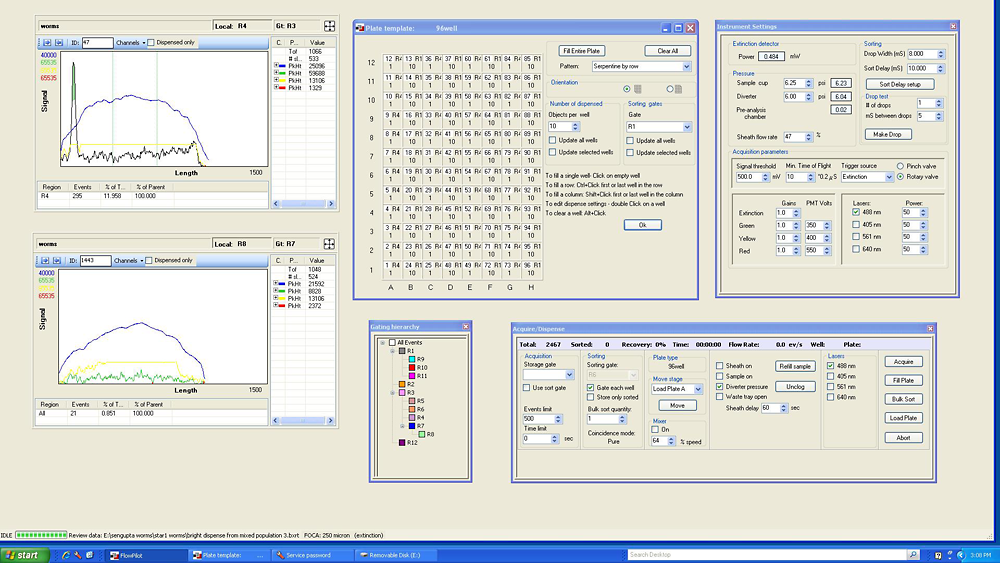
In this example, dual monitors are utilized to display more data and system setup parameters simultaneously.
The dynamic Flow Pilot desktop allows the user to easily access or hide: instrument control, data acquisition and dispensing panels based on personal preference. Users can define and manipulate multiple independent graphical and statistical displays of acquired data including multiple regions per plot, custom scaling and logical gating options. Retrievable experiment and sample template files as well as options included for data review (on instrument or offline) provide powerful tools for post-acquisition analysis.
The new Sort Delay Setup tool aids the user in identifying and implementing the optimal conditions (timing) for accurate and efficient dispensing.

Dispensing is not limited to standard multiwell receptacles. The user can create custom output receptacle templates with well to well dimensions as tight as 384 well standards. The BioSorter includes a third (Z)axis that can accommodate deep well plates or other tall output collection containers. Further, each dispense location may be given a different combination of sort conditions (i.e., object number and gate region).
Configuration of auto-stop conditions, auto-cleaning and other maintenance functions as well as user notifications allow the researcher to walk away during instrument use. And Flow Pilot incorporates additional integration features (i.e. coupling it with LP Sampler and robotic handlers) for higher through-put processing of samples in multi-process workflow stations.
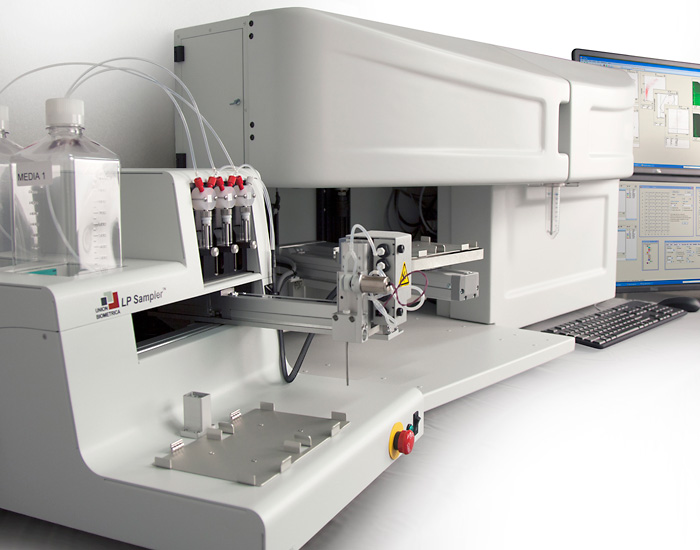
For more details about LP Sampler (autosampler) see “BioSorter Accessories.”
Profiler™ (FlowPilot-Pro™ software)
This package seamlessly integrates all the features of Profiler into the FlowPilot software suite.
Like most flow cytometer software, the standard FlowPilot software provides a single integrated signal measurement for each parameter of an object and these signals are used for analysis and sorting decisions. But most large objects are NOT homogeneous in terms of fluorescence or optical density … so we created “Profiler” software.
Profiler takes data collection to the next level by simultaneously recording up to 8,000 data points per object for each of the four optical parameters: extinction and three fluorescence channels. The software then graphically and numerically displays variations of those signals along the length of an object as a succession of peaks and valleys that directly trace the fluorescence intensity of the object as it passes through the flow cell. The result is an “optical profile” of each object graphically mapping the location and intensity of all four optical parameters plus determining values for peak height, peak width, peak count and relative position – all of which can be used as sort criteria.
Instrument sorting capabilities are further extended with user definable sort criteria for profile peak heights, widths, locations, and number for each optical parameter.
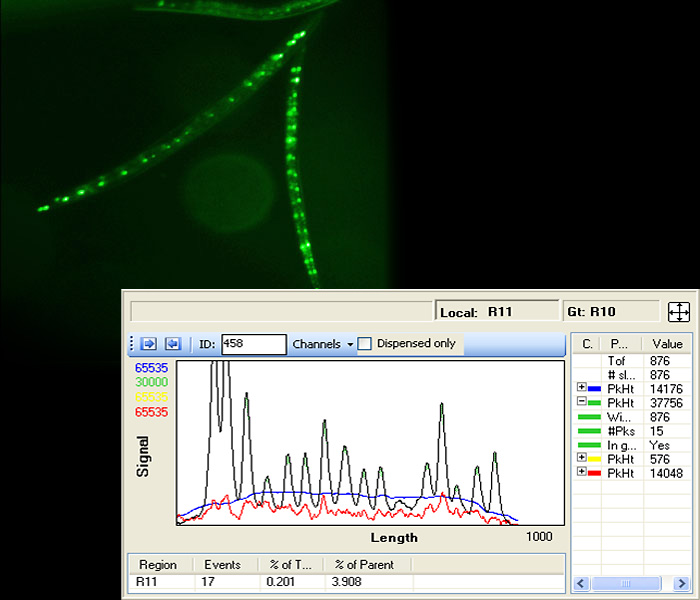
Digitizes optical density and fluorescence patterns along the axial length of the object as it passes through the flow cell. Example: Profiling GFP-expressing seam cells in nematodes. (Courtesy of Appleford at the Woolard lab, U. of Oxford.)
Another profiling feature is Partial Profiling. By zeroing in on one region of the profile, Partial Profiling allows you to strategically identify optical or fluorescence characteristics from that area alone. With Partial Profiling active, profile features (peak height, width or count) as well as integrated values over that limited portion are now analyzed and graphed as their own customized parameter (pp). Partial Profiling can be configured to analyze extinction and fluorescence measurements exclusively to the organism’s head, tail, middle, or end regions. For example, presence of greenpp[head] HEAD NEURONS vs redpp[center] OVARY regardless of any other green or red fluorescence in the animal). (*pp indicates partial profiling is active in the head area [head] or center of object [center])
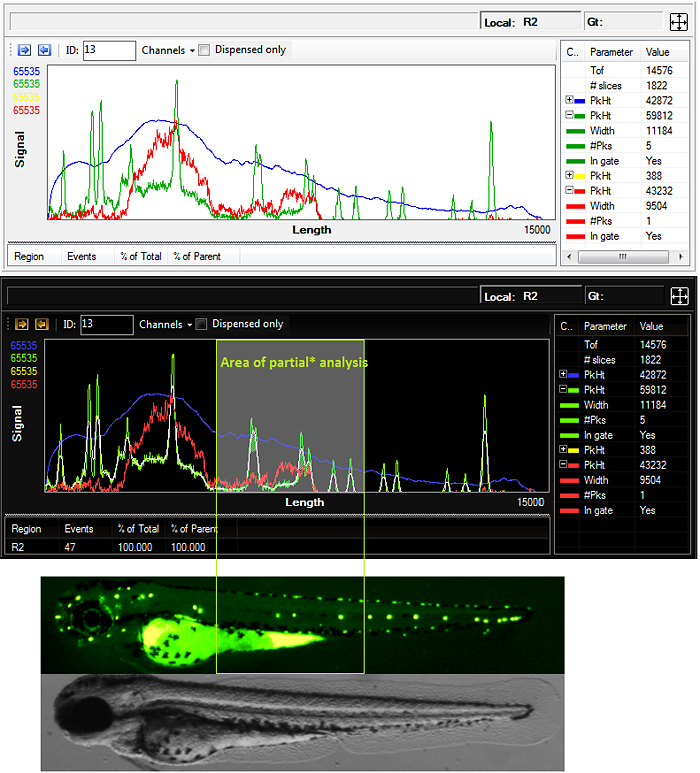
Zebrafish Partial Profiles.
Integration Package for BioSorter
The Integration Package for BioSorter is an option designed for High Throughput Screening applications requiring handling of large number of objects to be sorted and large numbers of multi-well plates. The additional software enables the BioSorter instrument to be controlled by a plate handler or by the “Master Scheduler” of an integrated High Throughput Screening System. The system can be configured to stop and notify an operator via email when reservoirs need refilling or other attention is required.

